
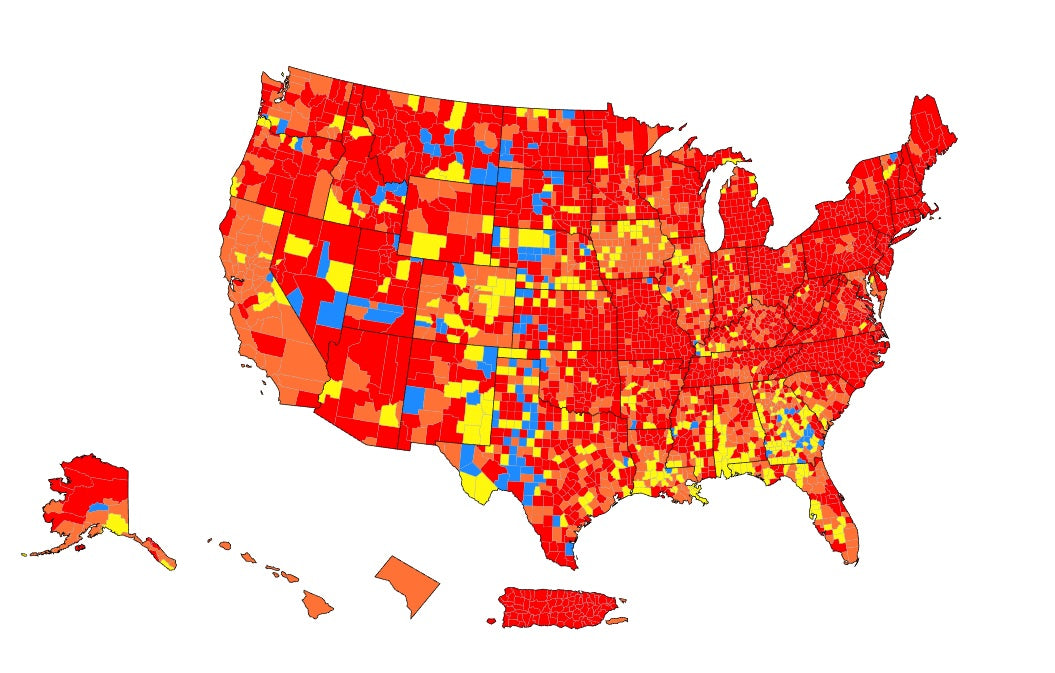
The CDC maintains an up-to-date county map for COVID-19 transmission in the United States. The website maps the transmission rates across different counties and determines the risk by comparing the new cases per 100,000 people and the percentage of positive NAATs tests.
These values are monitored over the previous 7-day period, and if either is above the threshold for low-risk, moderate-rate, substantial-risk or high-risk, the county is considered as such. While the map lacks data on a smaller scale, the county-wide data provides valuable insights into the importance of wearing a mask.
Overall, the percentage of counties with community transmission at high risk is decreasing. Although the percentage of high-risk counties still sits at around 61%, this is a significant drop from 73% in the previous period.
Counties with a substantial risk of COVID-19 transmission have increased, likely including many of the counties dropping from high risk. Currently, the percentage of substantial risk counties sits at 23.56%, up 6.27% from the previous period.
Moderate (11.61%) and low (4.03%) risk counties comprise the rest of the country. Unsurprisingly, the vast majority of the lower-risk countries are considered non-metropolitan. However, regardless of whether metropolitan or not, many counties remain at high and substantial risk levels.
The CDC provides a great way to stay up to date with the latest COVID-19 news if you live in the U.S. Not only do they keep this map up to date, but they also send out weekly newsletters with the latest stats to those interested.
Overall, the data shows that COVID-19 remains prevalent. It’s important to take precautions to keep safe, especially in higher-risk counties. Want to look at the updated map? You can do so here.